

Web Application Attacks & Cyber Resilience
A Board-Level View of the Verizon 2026 Data Breach Investigations Report
Web application attacks fell from 18% of breaches in 2025 to 10% in 2026 — and that decline is a trap, not a victory. The stolen credentials and unpatched vulnerabilities that drive these attacks are also strongly connected to broader breach categories such as System Intrusion (61% of breaches) and ransomware (48%). Meanwhile, the median time to fully remediate a critical, known-exploited vulnerability has risen to 43 days — the digital front door can remain exposed for roughly six weeks while remediation is completed. The board-level question is no longer “can we block attacks on our website,” but “how fast can we detect, contain, and recover across our entire web and API surface.” |
Why this belongs on the board agenda
Web applications and APIs are no longer a technical concern owned solely by IT. They are the digital front door of the business: customer portals, payment systems, partner integrations, mobile-app backends, SaaS dashboards, admin consoles, and the revenue-generating platforms customers touch every day. When that front door is compromised, the consequences land squarely in the domains the C-suite is accountable for — revenue, customer trust, regulatory exposure, and operational continuity.
The Verizon 2026 Data Breach Investigations Report (DBIR), built on more than 31,000 real-world incidents and over 22,000 confirmed breaches across 145 countries, makes the strategic shift explicit: cyber risk is no longer only about preventing attacks. It is about cyber resilience — the ability to anticipate, withstand, respond to, and recover from incidents with minimum business disruption.

Figure 1. The digital front door: web applications, APIs, and third-party integrations are the new entry points to the business.
Where the risk ranks today
The DBIR groups incidents into recurring patterns. Basic Web Application Attacks rank third among breach patterns in 2026, at 10% of breaches. System Intrusion dominates, and the gap is wide:
Rank | Breach pattern (2026) | Share of breaches |
1 | System Intrusion | 61% |
2 | Social Engineering | 17% |
3 | Basic Web Application Attacks | 10% |
4 | Miscellaneous Errors | 8% |
5 | Privilege Misuse | 3% |
Top five patterns shown; the DBIR tracks seven in total.
Figure 2. Basic Web Application Attacks rank third among breach patterns in 2026. Source: Verizon 2026 DBIR.
The trap: the threat didn’t shrink — it relocated
At first glance, the trend looks like a win. Basic Web Application Attacks fell from 18% of breaches in 2025 to 10% in 2026 (they were 9% in 2024). It is tempting for leadership to conclude that web-application risk is receding.
It is not. The same two root causes that power web-application attacks — stolen credentials and unpatched, internet-facing vulnerabilities — are exactly what now drives the most damaging breach categories. System Intrusion, the multi-step pattern behind most ransomware, has climbed to 61% of breaches, and exploitation of web-facing services is one of its fastest-growing entry points. Credential abuse, considered across the full breach lifecycle rather than just the first step, still sits at the top at 39%.
In other words, the attack didn’t disappear — it became the opening move in a longer, more expensive game. The decline in the “web application” line item should not be read as reduced exposure; it should be read as a signal that the same weaknesses may be feeding breaches that lead to extortion and downtime. Do not declare victory because one number fell.
A note on what “System Intrusion” means. It is worth being precise, because the term is easy to misread as routine scanning or bot noise. It is neither. System Intrusion is the DBIR’s category for successful, multi-step compromise — where external attackers combine exploited vulnerabilities, stolen credentials, malware, and hacking techniques to get in, move deeper, and monetize the access, most often through ransomware or data theft. Unauthorized scanning may be an early warning sign, but it is the intrusion and what follows it — not the probe — that this pattern captures. The scale is the reason it matters to the board: roughly 14,000 System Intrusion incidents this year, with ransomware present in more than three-quarters of the confirmed breaches among them. That is the destination a neglected web or API weakness can lead to.
What it costs you: exposure measured in time and money
For a CXO, the most actionable figures in the DBIR are the ones expressed in days and dollars, because they translate directly into windows of risk and balance-sheet impact.
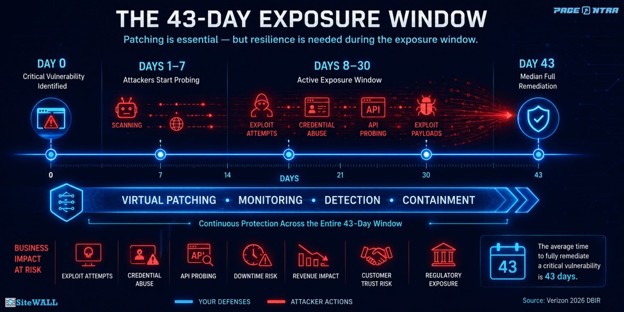
Figure 3. The 43-day median remediation window for critical vulnerabilities. Source: Verizon 2026 DBIR.
Day-by-day phases are illustrative of typical attacker activity and are not specific DBIR data points; the 43-day median is the reported figure.
DBIR 2026 metric | What it means for the business |
31% of breaches now begin with vulnerability exploitation (up from 20%) — a 55% jump | Your unpatched, internet-facing software is now the #1 way attackers get in |
Only 26% of critical known-exploited vulnerabilities are fully patched (down from 38%) | A large share of critical, known-exploited vulnerabilities remains partially or fully unresolved, extending the business exposure window |
43-day median time to full remediation (up from 32) | A potential six-week exposure window for critical flaws |
Ransomware in 48% of breaches; median ransom paid $139,875 | Roughly one in two breaches now carries an extortion event and a direct cash demand |
Third-party involvement up 60%, now in 48% of breaches | Nearly half of breaches reach you through a vendor, integration, or API you don’t directly control |
The single most board-relevant number is the 43-day median remediation window. It means that for critical flaws already known to be exploited in the wild, the typical organization may carry measurable exposure for roughly six weeks while remediation is completed. Patching alone cannot close that gap fast enough — which is why the conversation moves from prevention to resilience.
How a “basic” attack becomes a business crisis
The DBIR describes these attacks as low in sophistication — closer to “they left the door open” than a cinematic heist. But the business risk is not low. Within this pattern alone the report records 3,217 incidents and 2,281 confirmed data breaches, 100% driven by external actors, and 74% financially motivated. The data compromised tells the escalation story: credentials (52%), internal data (48%), and secrets such as API keys and tokens (15%).
How the attack starts | How it becomes a business crisis |
Stolen credentials (52% of these breaches) | Account takeover, fraud, and a reusable key into cloud and SaaS systems |
Unpatched web or API vulnerability | An initial foothold that supports lateral movement and ransomware |
Exposed API key or token | Cloud/SaaS abuse, bulk data extraction, machine-to-machine access |
Weak authentication | Unauthorized access to portals, admin panels, and APIs |
Poor visibility / slow response | Longer dwell time, larger breach, greater downtime and reputational damage |
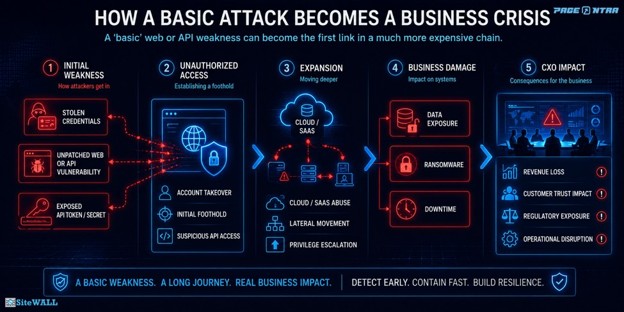
Figure 4. A basic web or API weakness can become the first link in a longer, costlier breach chain.
Because credentials are reusable, a single web-application breach rarely stays contained. Harvested passwords, API tokens, and session tokens become the fuel for cloud abuse, lateral movement, and the larger System Intrusion and ransomware events described above. The “basic” attack is usually the first link in a much more expensive chain.
The third-party and API blind spot
The DBIR does not rank API attacks as a separate category, but APIs sit at the center of the web and cloud attack surface — and at the center of third-party risk. That risk is rising sharply: breaches involving third parties increased 60% year-over-year and now account for 48% of all breaches. APIs, SaaS integrations, OAuth tokens, and partner access are precisely where that exposure concentrates.
For leadership, this reframes the perimeter. Much of your exposure no longer sits inside infrastructure you directly operate. It sits in tokens, integrations, and machine-to-machine connections that need to be discovered, monitored, and governed as deliberately as any employee account.
What this means for India and APAC
For an Indian board, the global trend tells only half the story — and the regional half is more pointed. Globally, Basic Web Application Attacks fell to 10% of breaches. In the Asia-Pacific region, they did the opposite: they doubled, to 22% of breaches. That single contrast sharpens this paper’s central argument: the decline is a trap, and for enterprises in this region it is not even a decline. The global average masks a regional movement in the wrong direction.
A note on scope: the DBIR does not publish India-only figures, so the defensible lens is APAC, the region that includes Southern Asia and therefore India. Read directionally, the APAC picture reinforces every theme above. Three patterns — System Intrusion, Basic Web Application Attacks, and Social Engineering — account for 97% of regional breaches, with System Intrusion alone at 60%. The root causes are the same ones this paper has tracked: exploitation of vulnerabilities appears in 42% of breaches, credential abuse in 25%, and phishing in 15%, while third parties are involved in 69% and the human element in 71%. One figure stands out for any organization running APIs and cloud integrations: secrets such as tokens and keys appear in roughly 28–30% of APAC breaches, more than double the 13% seen globally. For Indian boards, the implication is sharper: web and API security is not website protection — it is enterprise cyber resilience, third-party governance, and credential-risk reduction.
What the board should own, fund, and measure
Resilience is a governance outcome, not a tool purchase. The DBIR findings point to a small set of high-leverage controls; expressed as board-level commitments with a metric attached, they become something leadership can actually steer:
What leadership should own | Metric to report to the board |
Mandate MFA on every externally-exposed application and remote access path (the DBIR’s own top control) | % of internet-facing apps and admin paths protected by MFA |
Set and enforce a remediation SLA for critical vulnerabilities | Median days-to-remediate vs. the 43-day industry benchmark |
Maintain a continuous inventory of internet-facing web apps and APIs | % of known web/API assets under active monitoring |
Govern third-party and API exposure as first-class risk | # of vendors/integrations with privileged or token-based access, and their MFA status |
Fund detection, containment, and recovery — not prevention alone | Mean time to detect and mean time to contain a web/API incident |
Five questions a board can ask its security leadership, drawn directly from this data: Do we know every web app and API we expose? Can we shield a vulnerable application during the 43-day patch window? Can we detect credential abuse and bot traffic before it becomes account takeover? Can we keep services available during an attack? And can we produce, in real time, the evidence we need for response, audit, and regulatory notification?
The bottom line for leadership
Web-application attacks may be labelled “basic,” but their impact is not. They compromise credentials, expose internal data, leak secrets, and open the path to ransomware and system-wide intrusion — with financial, operational, regulatory, and reputational consequences. The fact that their share of breaches fell this year is not reassurance; it is a signal that the same weaknesses may feed costlier attacks.
The executive priority is no longer “protect the website.” It is to build cyber resilience across the entire web and API attack surface — visibility, exploit shielding during patch windows, credential-abuse detection, API protection, rapid containment, and business-level reporting that lets leadership govern the risk rather than merely react to it.
How SiteWALL supports
The following describes how SiteWALL can be positioned against the priorities above. It is vendor commentary and should be evaluated on its own merits, separately from the independent DBIR findings.
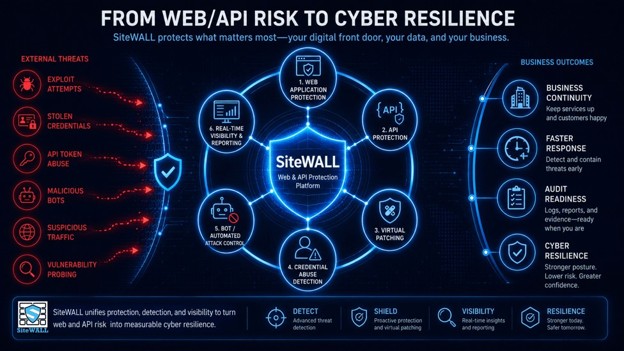
Figure 5. SiteWALL Web & API Protection Platform — vendor capability overview.
- Protecting the digital front door — protecting customer-facing applications, portals, admin panels, and APIs from injection, malicious payloads, automated scans, and exploit attempts.
- Virtual patching — shielding vulnerable applications during the exposure window while permanent fixes are completed, directly addressing the 43-day remediation gap.
- Reducing credential abuse and account takeover — detecting suspicious logins, brute force, and credential-stuffing patterns, addressing the 52% of these breaches that involve credential compromise.
- API protection — monitoring API endpoints, enforcing request controls, and limiting abusive or token-based access.
- Visibility for faster response — real-time dashboards, alerts, and logs that show who is attacking, what is targeted, and what was blocked — shortening response time and supporting audit and compliance.
- Escalation visibility — correlating web and API attack activity with credential abuse and unusual access patterns, so that early signs of movement toward System Intrusion can be surfaced and acted on rather than discovered after the fact.
Web applications and APIs are now core business infrastructure. The Verizon 2026 DBIR shows Basic Web Application Attacks remain a top-three breach pattern, while vulnerability exploitation has become the leading way attackers get in. SiteWALL strengthens cyber resilience by protecting web and API assets, shielding vulnerabilities during patch windows, detecting credential abuse, surfacing escalation signals that point toward System Intrusion, and providing real-time visibility for faster response and business continuity.”
Source: Verizon 2026 Data Breach Investigations Report, 19th edition. Statistics are drawn from the report’s Key Findings, Results & Analysis, Incident Classification Patterns, Regions, and Industries sections. DBIR figures are independent of any vendor; the SiteWALL section reflects vendor positioning.