
CERT-In shows where attacks begin; the Verizon DBIR shows where they end — two complementary views of one cyber-risk cycle.
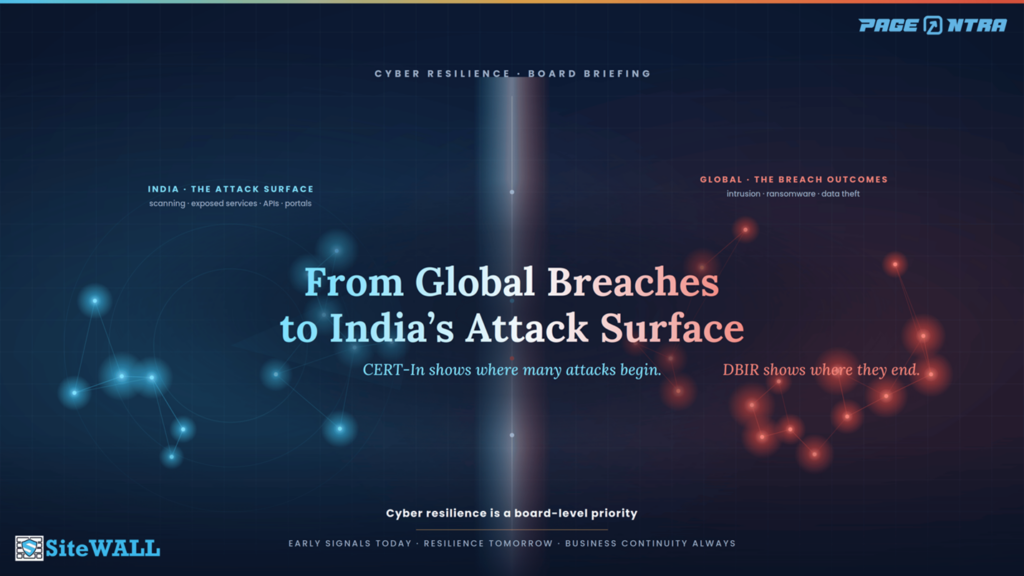
From Global Breaches to India’s Attack Surface
What CERT-In 2025 and the Verizon DBIR 2026 reveal about the next cyber-risk cycle
Executive summary
Cyber risk is no longer defined only by the breach that becomes visible after the damage is done. It is increasingly defined by the signals that appear before it — scanning, probing, exposed services, credential attacks and exploit attempts against internet-facing systems. Two highly relevant cybersecurity datasets from 2025–26, read together, tell that story from both ends.
CERT-In’s 2025 data shows India’s public-facing infrastructure under continuous reconnaissance. CERT-In handled 29,44,248 incidents in 2025, up roughly 44% from 20,41,360 in 2024. The single dominant category was Unauthorized Network Scanning/Probing at 24,36,320 incidents — nearly 83% of everything it handled — alongside 3,41,646 vulnerable services, 1,48,223 virus/malicious-code incidents, 8,386 website defacements, 1,118 website-intrusion and malware-propagation incidents and 806 phishing incidents.
The Verizon DBIR 2026 shows what happens when that exposure is converted into compromise. Built on more than 31,000 incidents and over 22,000 confirmed breaches across 145 countries, it puts System Intrusion at 61% of breaches globally and ransomware in 48%. Basic Web Application Attacks fell from 18% of breaches in 2025 to 10% in 2026 — but that decline is a trap, not a victory. The same root causes that drive web attacks — stolen credentials and unpatched internet-facing vulnerabilities — are now feeding the larger and costlier breach categories.
A note on how to read the two together. They are not measured on the same scale: CERT-In counts incidents reported and handled in India — a figure heavily weighted by automated scanning — while the DBIR counts confirmed breaches worldwide. So the two cannot be compared like-for-like. Their value is complementary: the DBIR shows where attacks end; CERT-In shows where many of them begin.
The board-level conclusion: do not wait for a breach to confirm cyber risk. Scanning, exposed services, abnormal API behaviour, credential abuse and exploit attempts are already business-risk signals. The right question has shifted from “are we protected?” to “how fast can we detect, shield, contain and recover across our web and API surface?”
How the two signals connect
Read as one picture, India’s early-warning signals line up against the global breach outcomes they tend to lead to:
Signal (India / APAC) | What it indicates | DBIR global breach outcome |
Scanning / probing | Attackers are mapping exposed assets | The reconnaissance that precedes initial access and exploitation |
Vulnerable services | Exploitable weaknesses exist on internet-facing systems | 31% of breaches now begin with vulnerability exploitation |
Website defacement / intrusion | Web compromise is already visible | A foothold that can escalate into System Intrusion (61% of breaches) |
Credential and login attacks | Access is being tested, stolen or reused | Credentials lead the data taken in web-app breaches (52%); credential abuse spans 39% of all breaches |
API, token and third-party exposure | The modern digital perimeter is widening | In APAC, third parties feature in 69% of breaches and secrets in roughly 28–30% |
Note: CERT-In does not publish credential, API, token or third-party exposure as separate incident categories. Those rows are included as DBIR global / APAC indicators. The first three rows map directly to CERT-In categories.
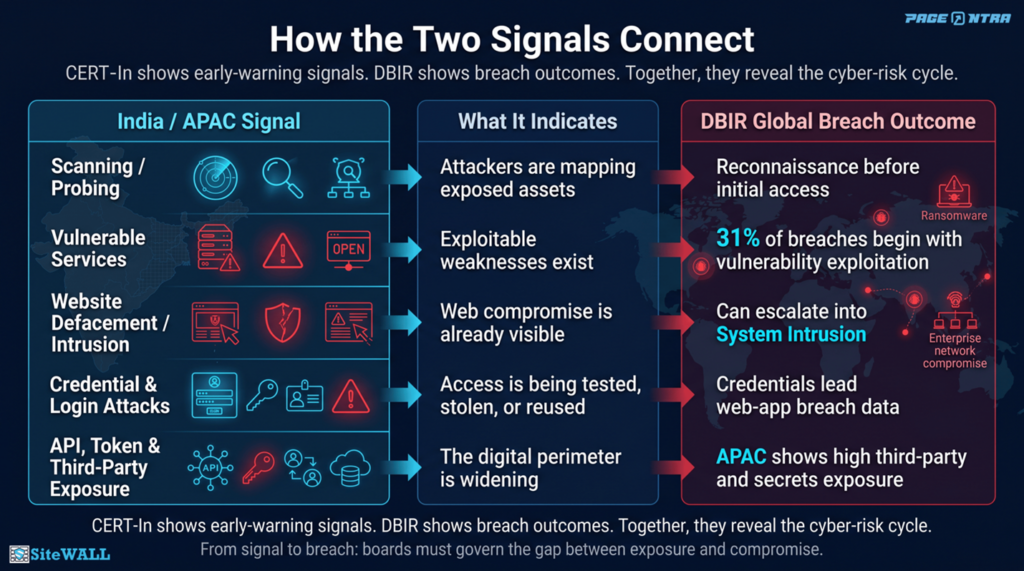
How the two signals connect: India / APAC early-warning signals mapped to global DBIR breach outcomes.
If you do only three things
- Build and maintain a live inventory of every internet-facing asset. Every public IP, domain, subdomain, API, admin panel, cloud endpoint and staging environment. Unknown assets are unmanaged risk.
- Put a WAF with virtual patching in front of critical public-facing applications and APIs. Reduce exposure during the patch window and block known exploit patterns, malicious payloads, bots and reconnaissance.
- Treat scanning and probing as a monitored early-warning signal. Correlate it with vulnerable services, authentication failures, API anomalies, WAF logs and SIEM alerts — not as background noise.
Two reports, two vantage points
The Verizon DBIR is built on real-world incidents and confirmed breaches. It explains how attacks succeed, which patterns dominate, what data is taken and how an incident becomes a business event. CERT-In’s data, published in the APCERT Annual Report 2025, captures the scale of reported cyber activity in India — scanning, probing, vulnerable services, defacements, intrusion, malware propagation and phishing.
A scan is not always a breach. A vulnerable service is not always exploited. A defaced site does not always become ransomware. But these are not isolated technical events; they are connected stages of the same attack chain. Read together, the two datasets let a board see the full arc — from early reconnaissance to business impact — rather than only the part that ends up in an incident report.
India’s signal: reconnaissance now dominates
The most important shift in CERT-In’s 2025 data is not that incidents rose. It is that one category now defines the national picture. Scanning/probing has climbed from under a quarter of reported incidents in 2022 to more than four in five in 2025.
Year | Total incidents | Scanning / probing | Vulnerable services | Defacements |
2022 | 13,91,457 | 3,24,620 | 8,75,892 | 19,793 |
2023 | 15,92,917 | 4,47,720 | 9,41,592 | 10,665 |
2024 | 20,41,360 | 16,10,608 | 2,94,908 | 5,496 |
2025 | 29,44,248 | 24,36,320 | 3,41,646 | 8,386 |
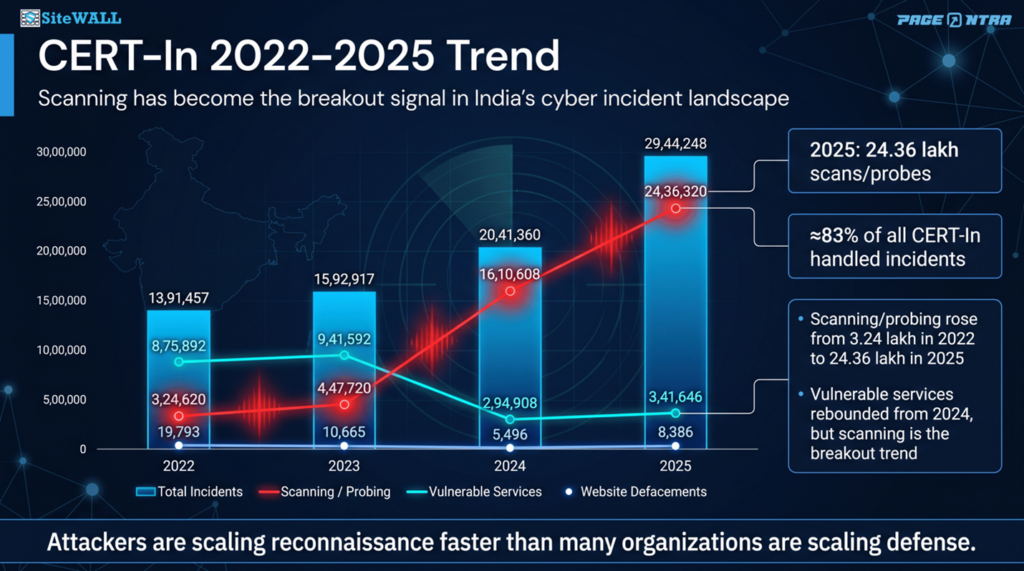
CERT-In 2022–2025: scanning/probing has become the breakout signal in India’s incident data.
One nuance keeps the analysis honest: vulnerable services are rebounding from a sharp 2024 dip rather than reaching a new high — they stood at 9,41,592 in 2023 before falling to 2,94,908. The signal that has genuinely broken out, and stayed out, is scanning. A second nuance matters just as much: part of the rise in detected scanning reflects better visibility, not only more attacker activity. CERT-In’s Cyber Swachhta Kendra now covers roughly 98% of the subscriber base, and expanded telemetry naturally surfaces more of the probing that was always there. The trend is real; its exact magnitude should be read with that in mind.
Even allowing for that, the risk it points to is straightforward. Scanning tells us attackers are actively looking. Vulnerable services tell us they are likely to find something. When both appear together at national scale, scanning stops being noise and becomes the first visible indicator of intent. For a CISO that is an early-warning signal; for a CIO an exposure-management problem; for a CEO or board, a question of business continuity and customer trust.
The 15-minute clock
Palo Alto Networks’ Unit 42 has reported that attackers can begin scanning for a newly disclosed vulnerability within about 15 minutes of the CVE going public, with first exploitation attempts often arriving within hours. (The figure originates in Unit 42’s 2022 incident-response research and continues to be cited; it is a directional benchmark, not a 2026 measurement.) It reframes the vulnerability-management question from “how fast can we patch?” to “can we protect and monitor exposed systems while patching is still in progress?” In most organisations, patching needs testing, approvals, downtime windows and vendor coordination. Attackers do not wait for that process to finish. That gap is where the risk window opens.
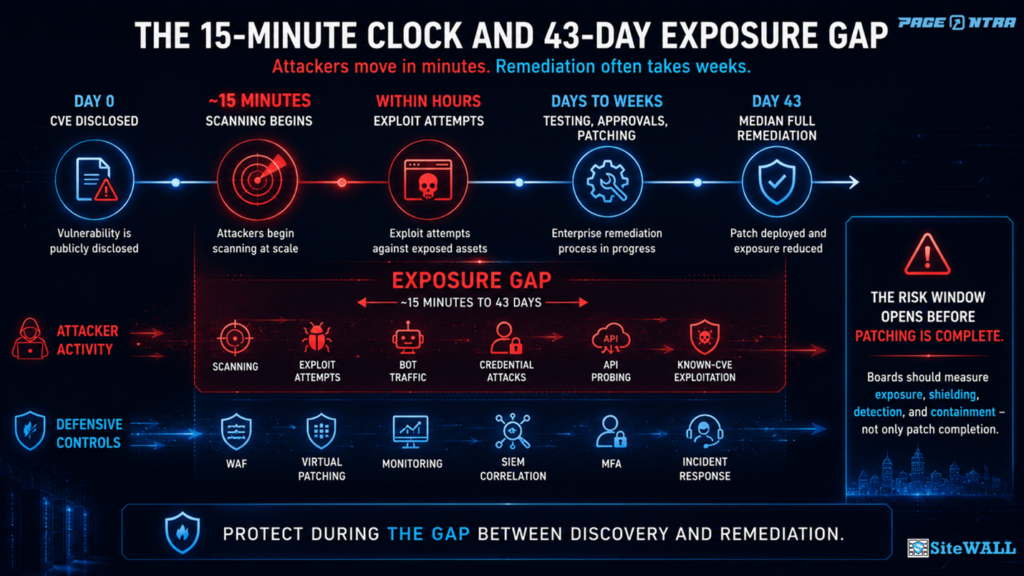
The exposure gap: attackers move within ~15 minutes; full remediation of a known critical vulnerability takes a median of 43 days. (Scan-to-disclosure timing: Unit 42, 2022. Remediation median: DBIR 2026.)
The global signal: web risk has relocated, not receded
On its face, the DBIR’s headline looks reassuring: Basic Web Application Attacks fell from 18% of breaches in 2025 to 10% in 2026 (they were 9% in 2024). It would be a mistake to read that as reduced web risk.
The same two root causes that power web-application attacks — stolen credentials and unpatched, internet-facing vulnerabilities — are exactly what now drives the most damaging categories. System Intrusion, the multi-step pattern behind most ransomware and data theft, has climbed to 61% of breaches; this year it represents roughly 14,300 incidents, with ransomware present in 77% of its confirmed breaches. The attack did not disappear; it became the opening move in a longer, more expensive game. A vulnerable web app, exposed API or weak login may simply no longer be classified as a “web application attack” once the attacker moves deeper — it resurfaces as System Intrusion, ransomware or third-party compromise.
It is worth being precise about System Intrusion, because the term is easy to misread as routine scanning or bot noise. It is neither. It is the DBIR’s category for successful, multi-step compromise, where external actors combine exploited vulnerabilities, stolen credentials and malware to get in, move deeper and monetise the access. Scanning may be an early warning; the intrusion and what follows it is the destination a neglected web or API weakness can lead to. The honest reading of the falling web-attack number is therefore not “web risk is down” but “web and API weaknesses are increasingly the entry points into larger enterprise breaches.”
The common thread: vulnerability exploitation
The strongest bridge between the two datasets is vulnerability exploitation. In the DBIR, it is now the leading initial-access vector, present in 31% of breaches, up from 20% — a 55% jump — making unpatched internet-facing software the single most common way in. And the exposure window is widening: only 26% of critical, known-exploited vulnerabilities (CISA KEV) were fully remediated last year, down from 38%, while the median time to full remediation rose to 43 days, from 32 — roughly six weeks of measurable exposure on flaws already known to be exploited in the wild.
That connects directly to CERT-In’s 3,41,646 vulnerable-service incidents in India — exposed or unpatched web servers, CMS platforms, frameworks, APIs, middleware, databases and backend systems. The combination is the real risk: scanning has exploded, vulnerable services still exist at large scale, patching takes weeks, and attackers move in minutes. That is the exposure gap.
The bridge: credential and secret abuse
Web-facing systems are attacked not only for data but for access. Within Basic Web Application Attacks, the data compromised is led by credentials (52%), internal data (48%) and secrets such as API keys and tokens (15%). Because credentials are reusable, a single web compromise rarely stays contained: harvested passwords, API tokens and session tokens become the fuel for cloud abuse, lateral movement and the larger intrusion and ransomware events above. Considered across the full breach lifecycle rather than only the first step, credential abuse still sits at the top of the DBIR’s mitigation list at 39%.
This matters for India’s digital economy, where banking, fintech, government, e-commerce, healthcare, education and SaaS all depend on public-facing applications, APIs and internet-connected services. A compromised portal credential enables account takeover; an exposed API token enables bulk data extraction; a weak admin password enables defacement or malware injection. Web application security can no longer be treated as website security alone — it is identity, API, cloud and third-party security at once.
The regional read: APAC and India
The DBIR does not publish India-only figures, so the defensible regional lens is Asia-Pacific, which includes Southern Asia. APAC should not be presented as identical to India, but it is directionally relevant — the region shares India’s pressures of rapid digitisation, cloud adoption, API-driven services and expanding public attack surfaces.
The regional contrast is pointed. Globally, Basic Web Application Attacks fell to 10% of breaches; within APAC they moved the opposite way, doubling to 22%. Three patterns — System Intrusion, Basic Web Application Attacks and Social Engineering — account for 97% of APAC breaches, with System Intrusion alone at 60% (against 61% globally). The initial-access mix mirrors the global root causes but runs hotter: exploitation of vulnerabilities in 42% of regional breaches, credential abuse in 25% and phishing in 15%. Third parties are involved in 69% of APAC breaches and the human element in 71%. One figure stands out for any organisation running APIs and cloud integrations: secrets such as tokens and keys appear in roughly 28–30% of APAC breaches, more than double the 13% seen globally.
Combined with CERT-In’s India-specific data, the picture sharpens: India is seeing reconnaissance and vulnerable-service exposure at national scale, while its region shows web-application attacks, system intrusion, third-party involvement and token exposure as leading breach factors. Together they point to rising web, API, credential and third-party risk for Indian organisations.
The next cyber-risk cycle
Read end to end, the two datasets describe one cycle in five stages:
- Reconnaissance — attackers scan websites, APIs, login and admin pages, exposed services, cloud endpoints and CMS platforms.
- Exposure discovery — they identify unpatched services, weak authentication, exposed APIs, misconfigurations, vulnerable plugins, forgotten subdomains and known CVEs.
- Exploitation — injection, path traversal, malicious file upload, credential stuffing, brute force, API abuse or known-CVE exploitation.
- Intrusion and expansion — a successful exploit or stolen credential becomes a foothold for credential harvesting, lateral movement, persistence and ransomware staging.
- Business impact — ransomware, data theft, defacement, service disruption, regulatory exposure, customer-trust loss and brand damage.
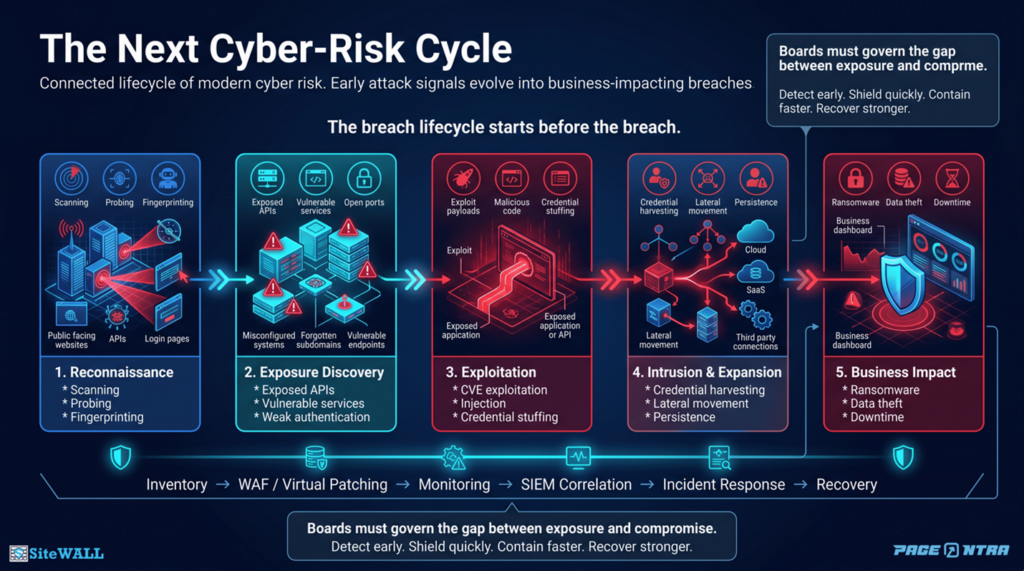
The next cyber-risk cycle: early attack signals evolve into business-impacting breaches, with a defensive control at every stage.
What this means for the C-suite
For CEOs and boards, public-facing applications are now customer, revenue, service and trust channels at once; when they fail, the impact reaches well beyond IT. For CIOs, every new portal, API, cloud service and release widens the attack surface, so asset visibility and secure architecture are baseline. For CISOs, the shift is from responding to incidents toward detecting the signals that precede them. For risk and compliance leaders, web and API weaknesses lead directly to data breaches, downtime, regulatory exposure and audit findings, so controls should be mapped explicitly to resilience and compliance requirements.
Where a WAF fits in the resilience model
The implication is not that any single control solves the problem, but that organisations need layered resilience during the gap between discovery and remediation.
VAPT, patching and secure coding are essential, and all three have practical limits. Applications change constantly, new APIs ship, legacy systems stay in production, and emergency patching needs testing, downtime and vendor timelines. In many organisations the exposure window is simply longer than the attacker’s scanning window. A web application firewall helps close that gap: it reduces risk while applications are being fixed — detecting and blocking exploit attempts, malicious payloads, bot-driven reconnaissance, injection attacks and known-CVE exploitation, and providing virtual patching and application-layer visibility. It does not replace secure coding, VAPT, patching, MFA or SIEM; it provides a control layer and visibility while those processes run.
A board-level cyber-resilience scorecard
Resilience is a governance outcome, not a tool purchase. These questions convert the analysis above into metrics leadership can fund, steer and report on.
Board question | Metric to track |
Do we know our internet-facing attack surface? | % of public apps, APIs, domains, subdomains and services inventoried and monitored |
Are we being scanned and probed? | Volume of scanning/probing detected and blocked, trended over time |
How exposed are we right now? | Count of critical/high vulnerabilities on internet-facing systems |
How fast do we close them? | Median days to remediate critical vulnerabilities vs. the 43-day DBIR benchmark |
Can we shield during the patch window? | % of critical vulnerabilities covered by virtual patching or WAF rules |
Are credentials under attack? | Brute-force, credential-stuffing, suspicious-login and MFA-failure trends |
Is MFA actually enforced where it matters? | % of internet-facing apps and admin paths protected by MFA |
Are third parties widening our exposure? | Number of vendors/integrations with privileged or token-based access, and their MFA status |
Can we detect escalation early? | Mean time to detect and contain a web/API incident; correlation across WAF, IAM, EDR and SIEM |
Can leadership see the risk? | Monthly board view of exposure, blocked attacks, remediation status and incident readiness |
How SiteWALL support this resilience model
The findings point to a practical requirement for Indian organisations: protect the web and API layer during the gap between exposure and remediation. SiteWALL helps address that gap by providing a web application firewall layer for public-facing applications, portals, admin panels, APIs and legacy systems.
It can support the priorities in this briefing by helping organisations detect reconnaissance, block exploit attempts, reduce credential-abuse risk, apply virtual patching during remediation windows, monitor API and token-based access, and generate real-time visibility for IT, risk, audit and compliance teams.
This does not replace secure coding, VAPT, patching, MFA, SIEM or incident response. It strengthens them by adding protection and visibility at the point where attackers often begin: the public-facing web and API surface.
The breach of tomorrow may begin with the scan of today. In the next cyber-risk cycle, the first visible signal may not be ransomware, data theft or malware. It may simply be a scan against an exposed API, login page, admin panel or vulnerable service. That is the moment an organisation must already be ready — with a known attack surface, vulnerabilities shielded while they are fixed, credentials and tokens protected, logs correlated, and a board that tracks cyber resilience before the breach becomes visible.
Data note and sources
CERT-In 2025 figures: APCERT Annual Report 2025, CERT-In section, Table 2, “Breakup of Security Incidents handled” (TLP:CLEAR). All 2025 figures in this paper were verified against that table. Historical 2022–2024 figures are drawn from the APCERT Annual Reports 2022, 2023 and 2024 (CERT-In section, Table 2 in each) and were verified against those sources. Global and regional figures: Verizon 2026 Data Breach Investigations Report, 19th edition (Key Findings, Results & Analysis, Incident Classification Patterns, and Regions sections), verified against the published report. CVE scan-to-exploit timing: Palo Alto Networks, Unit 42. DBIR and CERT-In figures are independent of any vendor; the SiteWALL section reflects vendor positioning.