

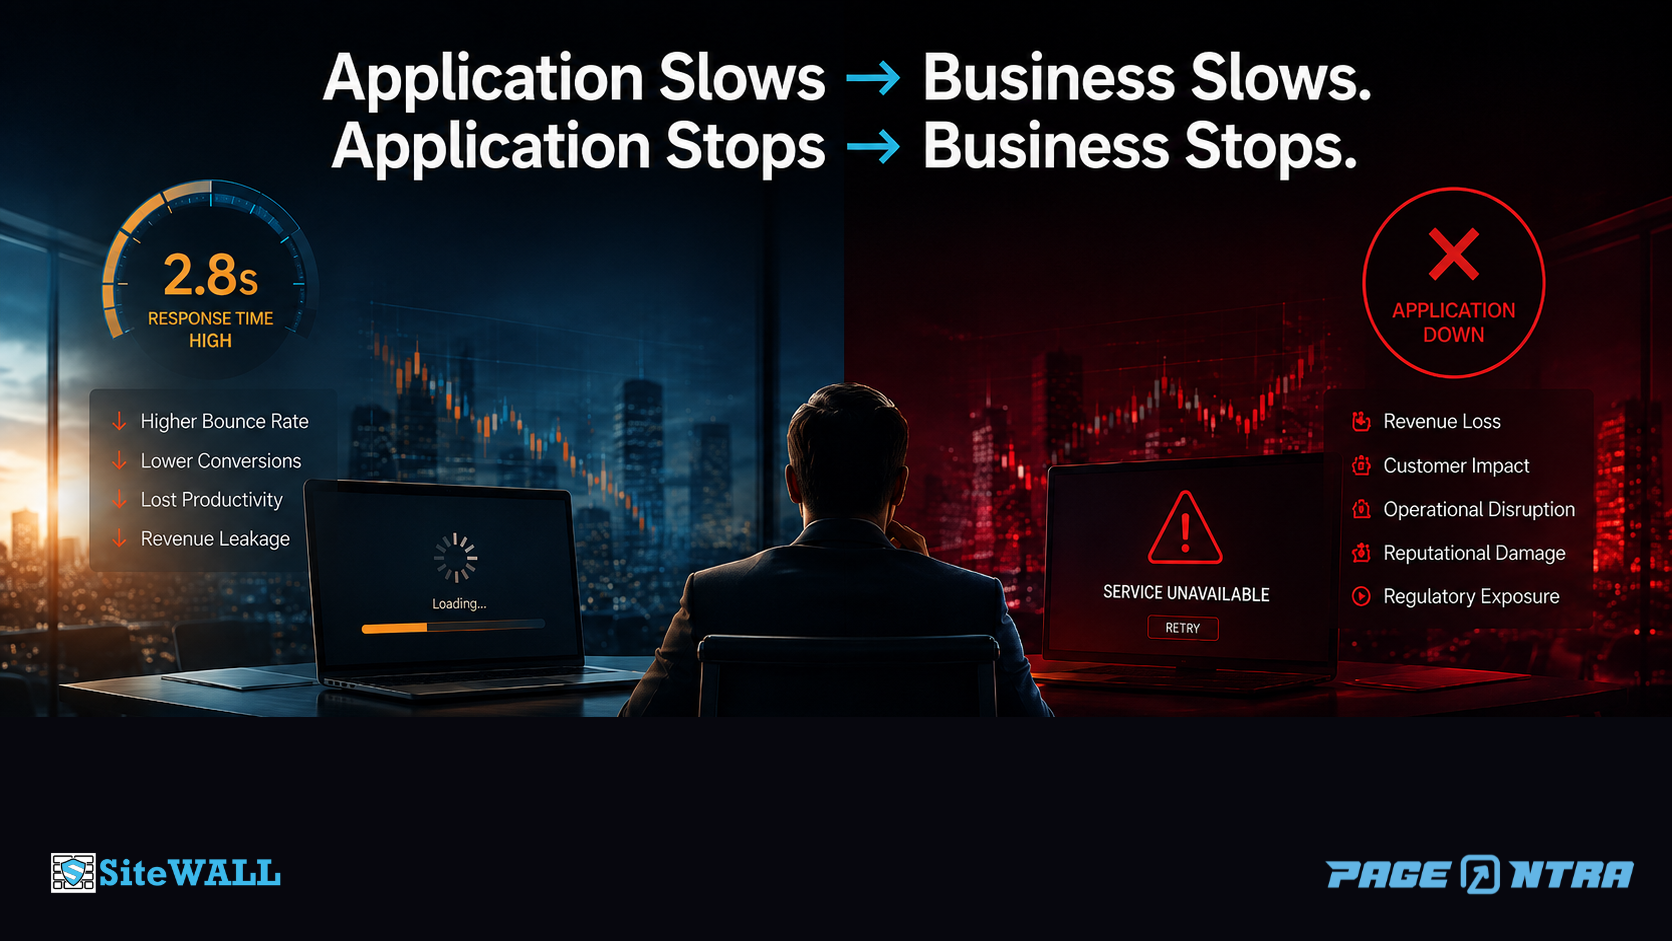
Application Slows → Business Slows. Application Stops → Business Stops.
Why application performance is now a board-level metric for revenue and resilience
Eight words. Two failure modes. One uncomfortable truth that many boardrooms still treat as an IT footnote.
For years, application performance lived inside an engineering dashboard — a technical indicator that mattered only when it turned red. That era is over. Today, the checkout page is the store. The claims portal is the insurer. The trading platform is the bank. In an increasingly digital business, the application is where the business meets the customer. When it slows, revenue, productivity, and customer experience slow with it. When it stops, business stops.
The relationship is not a metaphor. It is a direct line, with a measurable price tag.
Downtime creates a shock. Slowness creates a leak.
A slow application and a stopped one may first look like variations of the same technical problem: the system is not performing as expected. To the business, however, they create two very different forms of damage.
When a business-critical applicationstops, the crisis is visible. Transactions may freeze, customers complain, response teams mobilize, and leadership is alerted within minutes. It is painful, but it forces an immediate response. The financial exposure can be substantial. Uptime Institute's 2025 analysis of IT and data-center outages reported that 54% of respondents to its 2024 annual survey said their most recent significant, serious, or severe outage cost more than US$100,000, and one in five said it exceeded US$1 million. New Relic's 2025 global survey of more than 1,700 IT and engineering professionals across 23 countries reported a median cost ofUS$2 million per hourfor high-impact outages — roughly US$33,000 a minute — and a median annual cost ofUS$76 millionfrom high-impact IT outages among surveyed businesses. The two studies use different methodologies and should not be compared directly, but both underline the scale of the exposure. Beyond direct transaction losses, an outage may also bring recovery costs, contractual penalties, customer attrition, and reputational damage.
Aslowapplication creates a different — and often less visible — form of damage. It rarely triggers a crisis. Pages still load. Transactions still complete. Employees keep working. But every added delay creates friction, and that friction becomes abandoned transactions and lost productivity. In its Q1 2025 e-commerce dataset — covering more than 500 million visits to over 1,300 e-commerce sites — Yottaa found thatpages taking longer than four seconds to load recorded an average bounce rate of 63%, and reported a3% relative improvement in mobile conversion for each second saved. The figures vary by sector, but the direction is consistent: delay creates measurable commercial friction. And because there is no alarm, there is no urgency. By the time the impact becomes visible in churn, productivity, or quarterly performance, it can be hard to trace it back to months of accumulated friction.
Downtime shocks you. Slowness bleeds you. Either way, the business pays.
How the impact spreads across the enterprise
The reason this belongs on the CXO agenda — not the IT backlog — is that the impact does not stay inside IT. It reaches every part of the business at once.
Revenue and growth.Slowness is margin erosion in slow motion: abandoned carts, missed SLAs, decisions made on data that arrived too late to matter. A customer-facing outage is more immediate — transactions can stop, revenue can freeze, and contractual penalties may follow.
Operations and people.Every team that depends on the application inherits its performance. When it slows, employees invent workarounds and do more work for less output. When it stops, work stops — and the organization pays twice: idle time up front, and overtime later to clear the backlog.
IT capacity and innovation.Slowness traps engineering teams in alerts, incident calls, and root-cause work, consuming capacity that should be advancing the roadmap; technical debt accumulates while the team runs to stand still. An outage escalates that into a crisis, putting credibility at risk and pulling in post-incident reviews, audit scrutiny, and remediation.
Customers and brand.This is where every internal problem becomes external. Slowness does not always produce a complaint. Often, it simply produces a departure. Many customers will not explain why the experience disappointed them; they will simply choose a competitor that offers a better one. When an application stops, trust breaks in public, and the cost of rebuilding it can exceed the technical cost of restoring service.
Compliance and resilience.For regulated industries, a stopped system is not merely a revenue event. Depending on jurisdiction and the nature of the disruption, it can trigger reporting obligations, SLA breaches, audit scrutiny, and regulatory exposure that outlast the incident itself. This is no longer abstract. The EU's Digital Operational Resilience Act (DORA), applicable since 17 January 2025, sets requirements for ICT risk management, digital operational resilience testing, incident reporting, and oversight of third-party technology risk. Enforcement measures and penalties vary by jurisdiction and entity type.
Why this is now a board-level concern
Viewed together, the conclusion is difficult to ignore. Application performance is not a technical metric that occasionally has business consequences. It is a business metric measured through technical indicators. Latency affects revenue. Uptime sustains trust. Resilience protects reputation.
Treating it purely as an IT cost is like treating a storefront's lighting, doors, and locks purely as facilities expenses. Technically accurate — but strategically incomplete. The store creates value only when customers can enter, transact, and trust the experience.
But this is not an argument for making every system perfect. Not every millisecond has the same business value, and not every application needs the same level of resilience. A customer payment journey, a trading platform, and an internal information portal should not be funded or governed the same way. The priority is to understand business criticality and align investment accordingly.
That reframes it as a leadership question rather than a technology one. Which applications and customer journeys are economically critical? What level of degradation is commercially unacceptable? Who owns the business impact when performance drops? And how quickly can the organization detect, contain, and recover from failure?
Organizations that take this seriously do a few things differently. They identify the journeys that matter most, set business-level performance thresholds, watch for degradation before it becomes an incident, design systems to contain failure, rehearse recovery, and assign clear executive ownership. Observability is part of that discipline — not the whole of it. Done well, it earns its keep in three ways: surfacing degradation before customers feel it, isolating the business-critical path quickly, and tying technical signals to the customer journeys and revenue at stake.
And they put the right measures in front of leadership. The executive dashboard does not need infrastructure-level detail; it needs business-facing signals: availability of critical journeys, transaction completion rates, customer-impacting latency, revenue at risk, recovery time, and recurring incident trends. These measures connect technology performance directly to business outcomes.
The bottom line
The question is no longer whether application performance belongs on the executive agenda. It is whether leadership has identified the journeys that matter most, defined acceptable performance, assigned ownership, and funded the resilience required to protect them.
Application performance is not about making every system perfect. It is about ensuring that the parts of the business your customers and employees depend on do not become avoidable constraints on growth.
Application Slows → Business Slows. Application Stops → Business Stops.
A sharper test for your next review: have you quantified the revenue at risk in your top three customer journeys this quarter — and does someone outside IT own that number?
Research references:Uptime Institute, Annual Outage Analysis 2025 (industry research); European Supervisory Authorities, Digital Operational Resilience Act (DORA) (regulatory); New Relic, 2025 Observability Forecast; Yottaa, Q1 2025 Web Performance Index (findings drawn primarily from activity in September–October 2024). New Relic and Yottaa are vendor-published industry benchmarks and should be read directionally rather than as precise cross-sector constants.